Author: David Draper, PhD | Associate Director, Scientific Development
Date: July 2018
In this Tech Spotlight we will present the principles of absolute counting and the advantages this service provides when used in combination with tumor immunophenotypic analysis.
Absolute counting is an application that allows flow cytometry scientists to quantify the total number of cells within tissue and can be used as a measurement of tumor infiltration by immune cells. In this Tech Spotlight we will present the principles of absolute counting and the advantages this service provides when used in combination with tumor immunophenotypic analysis.
The ability to accurately measure dynamic changes in the immune response within the tumor microenvironment (TME) is critical when testing new immune modulating therapies. While the configuration of robust immunophenotyping panels is necessary to delineate subsets with precision, the method by which these endpoints are reported can impact how the data is ultimately interpreted. A common readout is “% of CD45+ cells,” which measures the relative distribution of each subset as a percent of total immune cells.1,2 This method is valuable because it helps quantify the effect that therapy has on the proportion of subsets with different pro- and anti-tumor activities. For example, an increase in the proportion of CD8+ T cells with a corresponding decrease in regulatory T cells indicates that treatment has reduced regulatory T cell-mediated immuno-suppression in the TME.
The use of distribution measurements as a sole readout however, has limitations. This is demonstrated in the example below. In this study, CT26 tumor-bearing mice were treated with an anti-mCTLA-4 checkpoint inhibitor that resulted in marked tumor growth inhibition (Figure 1). To examine the mechanism of action, we first used flow cytometry to profile the distribution of tumor-derived CD3+ and CD11b+ cells (T cells and myeloid cells, respectively) among the total CD45+ cells (see figure 2). The interpreter might conclude from this data that CTLA-4 blockade triggered both an increase in the number of T cells and a simultaneous decrease in myeloid cells. This would suggest that mechanistic activity of treatment is mediated by an expansion in the number of anti-tumor CD8+ T cells as well as a contraction of immuno-suppressive myeloid cells. As you’ll see below, this conclusion would be incorrect.
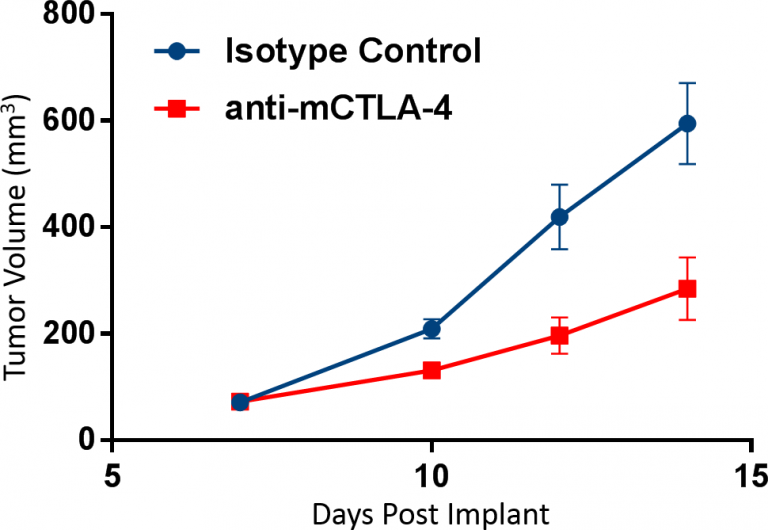
Fig. 1: CT26 cells were implanted subcutaneously into the right axilla of Balb/c mice. Dosing of n=10 animals/group was initiated when tumors were established, and tumor progression was monitored by caliper measurements. Antibody doses were administered twice weekly prior to sampling on day 14.
Tandem calculation of absolute counts is often used to overcome the limitation described above. This endpoint accurately measures the infiltration of tumors by immune subsets and is typically reported as total cell numbers per unit of mass.3,4,5 When the absolute counts are added to the study above, it becomes clear that in fact the total myeloid cell count/gram of tumor did not change following anti-mCTLA-4 therapy (Figure 2). Instead, the observed decrease in the proportion of myeloid cells is more likely caused by the demonstrated increase in absolute T cell numbers. The takeaway message is that when a change in distribution of a target subset is triggered by therapy, it is not necessarily due to a change in absolute numbers of that cell subset and instead may occur as a consequence of the expansion or contraction of a different subset.
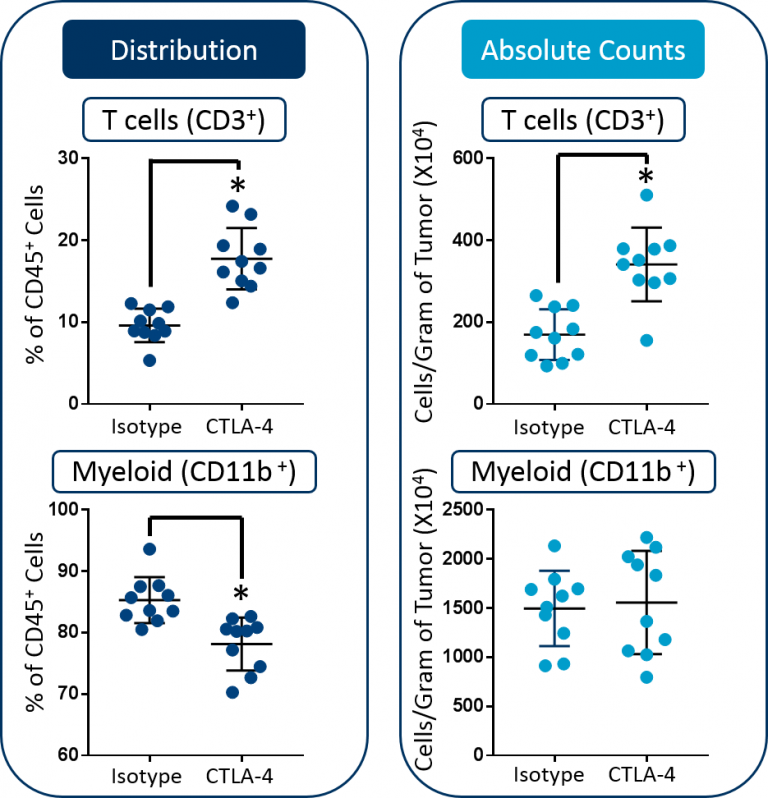
Fig. 2: Distribution versus absolute count measurements of T cells and myeloid cells in CT26 tumors. Statistical analysis was performed using a Student’s t-test (*p<0.05).
Downstream immunophenotypic analysis of tumor-associated macrophages (TAMs) and T cell subsets further emphasizes the value of including absolute count endpoints. As shown in Figure 3, although analysis revealed that the proportion of M2 TAMs decreased in the tumor, the absolute counts remained unchanged. Therefore, in contrast to the initial analysis, the absolute counts do not indicate that M2 TAM pharmacodynamics contributes to the overall efficacy in this study. And, this is a more reliable conclusion based on the available data. Finally, anti-mCTLA-4 therapy triggered an increase in the absolute numbers of both CD8+ T cells and CD4+ helper T cells. Taken together, these data demonstrate how absolute counts can be essential to accurately quantify the total cell numbers for tissue-derived subsets.
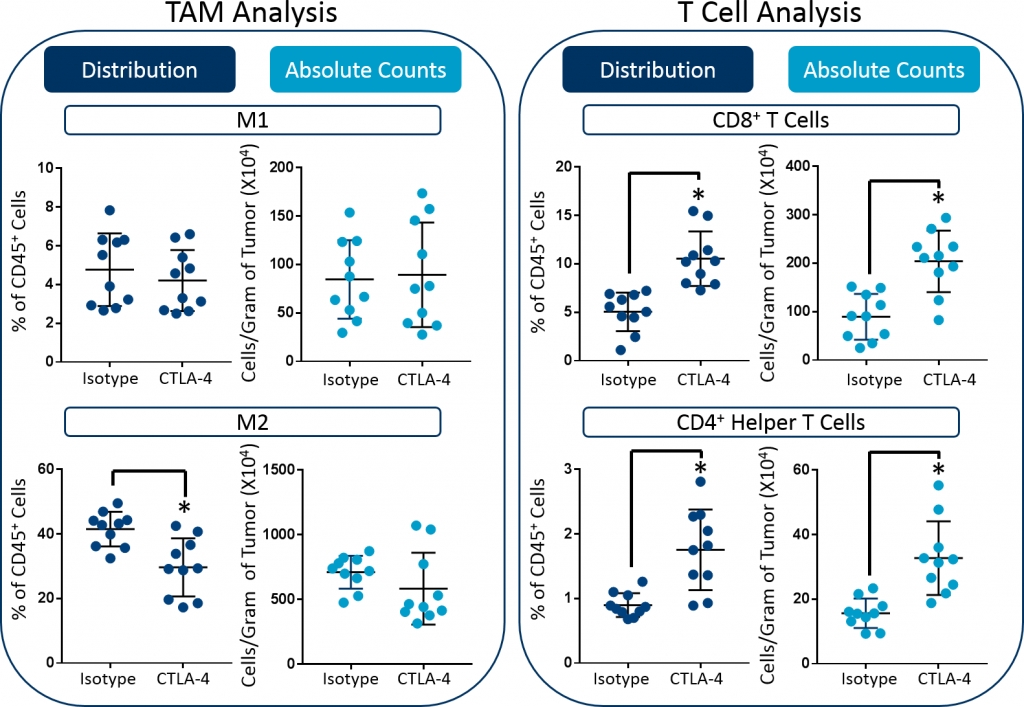
Fig. 3: Distribution versus absolute count measurements of M1 and M2 TAMs, CD8+ T cells, and CD4+ helper cells in CT26 tumors. Statistical analysis was performed using a Student’s t-test (*p<0.05).
Methodology of Absolute Counting
Downstream immunophenotypic analysis of tumor-associated macrophages (TAMs) and T cell subsets further emphasizes the value of including absolute count endpoints. As shown in Figure 3, although analysis revealed that the proportion of M2 TAMs decreased in the tumor, the absolute counts remained unchanged. Therefore, in contrast to the initial analysis, the absolute counts do not indicate that M2 TAM pharmacodynamics contributes to the overall efficacy in this study. And, this is a more reliable conclusion based on the available data. Finally, anti-mCTLA-4 therapy triggered an increase in the absolute numbers of both CD8+ T cells and CD4+ helper T cells. Taken together, these data demonstrate how absolute counts can be essential to accurately quantify the total cell numbers for tissue-derived subsets.
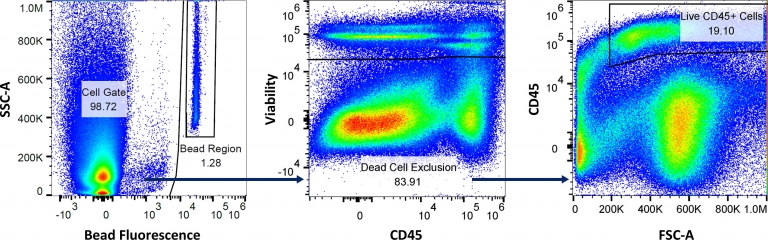
Fig. 4: Gating strategy to measure the volume of sample aspirated, absolute counts of total live cells, and live CD45+ cells, using the absolute counting flow panel.
Figure 4 illustrates how absolute cell counts are calculated. The Bead Region quantifies the number of beads acquired by the flow cytometer to enable the measurement of sample volume that is aspirated. The Cell Gate is analyzed using a viability dye, which excludes dead cells. And after dead cell exclusion, CD45 expression is measured to calculate the percentage of cells that fall in the Live CD45+ Cells gate. The total number of CD45+ immune cells detected by the cytometer is then calculated using the formula below. Finally, because the starting tumor mass is known, the cell counts/gram of tumor can be back-calculated.

The full data set for the above study is available by request. It describes checkpoint blockade effects on the counts and profile of the following subsets in CT26 tumors; as well as, the flow panels that were used to make these measurements.
Granulocytic myeloid-derived suppressor cells
Monocytic myeloid-derived suppressor cells
Dendritic cells
Tumor-associated macrophages (M1 and M2)
B cells
Natural killer cells
Natural killer T cells
CD8+ T cells
CD4+ helper T cells
Regulatory T cells
Contact the scientists at Labcorp to request the full data set or to learn more about our absolute counting service and how it can be applied to your preclinical research.
References
1Kadić, Elma, et al. “Effect of cryopreservation on delineation of immune cell subpopulations in tumor specimens as determined by multiparametric single cell mass cytometry analysis.” BMC immunology 18.1 (2017): 6.
2Lewis, Katherine E., et al. “Interleukin-21 combined with PD-1 or CTLA-4 blockade enhances antitumor immunity in mouse tumor models.” Oncoimmunology 7.1 (2018): e1377873.
3Muroyama, Yuki, et al. “Stereotactic radiotherapy increases functionally suppressive regulatory T cells in the tumor microenvironment.” Cancer immunology research 5.11 (2017): 992.
4Balza, Enrica, et al. “The therapeutic T‐cell response induced by tumor delivery of TNF and melphalan is dependent on early triggering of natural killer and dendritic cells.” European journal of immunology 47.4 (2017): 743-753.
5Buisseret, Laurence, et al. “Tumor-infiltrating lymphocyte composition, organization and PD-1/PD-L1 expression are linked in breast cancer.” Oncoimmunology 6.1 (2017): e1257452.
Note: Please note that all animal care and use was conducted according to animal welfare regulations in an AAALAC-accredited facility with IACUC protocol review and approval.
Connect
Let's start a conversation
Contact Us
Labcorp is a leading global life sciences company that includes contract research and developmental services to the pharmaceutical, medical technology, crop protection and chemical industries.